The HUVEC tube formation assay measures how a peptide alters endothelial network formation on reduced-growth-factor basement membrane extract. You seed low-passage HUVECs at 10,000 to 15,000 cells per well, apply peptide dilutions against matched vehicle controls, and image the resulting networks within a fixed window before regression begins. Quantification covers total tube length, nodes, branch points, loops, meshes, and covered area. Dose-dependent increases indicate proangiogenic activity, and fragmented connectivity indicates inhibition, provided cytotoxicity has been ruled out as the cause.
Key Takeaways
- HUVEC tube formation tests how peptides affect endothelial network assembly on reduced-growth-factor basement membrane matrix.
- Seed 10,000 to 15,000 low-passage HUVECs in 100 μL medium per 96-well after matrix gelation.
- Structures begin forming within 2 to 4 hours, mature by 4 to 6 hours, and regress after roughly 18 to 24 hours, so the imaging timepoint must be fixed in advance.
- Quantify tube length, branch points, nodes, loops, meshes, and covered area against matched vehicle controls.
- The assay reports phenotype, not mechanism. A network change establishes endothelial responsiveness, not the pathway that produced it.
What are HUVECs and what do they represent
HUVECs are human umbilical vein endothelial cells, primary macrovascular cells widely used as an accessible human endothelial model. They retain angiogenesis-relevant signaling, adhesion, migration, and survival responses at low passage, commonly P2 to P5, which is why passage number is a controlled variable rather than an incidental detail.
What they represent is narrower than the assay’s name suggests. HUVECs are one cell type in isolation. The model contains no pericytes, no smooth muscle, no immune cells, and no perfusion. Tube formation on a basement membrane gel is not vessel formation. It is a coordinated migration and alignment behavior that correlates with angiogenic capacity, and the correlation is the reason the assay is useful, not evidence that a vessel has been built.
Two consequences follow for interpretation:
- Donor variability is real. HUVECs are primary cells from individual donors. Lot-to-lot differences in baseline network density are expected, which is why every comparison runs against a vehicle control from the same lot rather than against a historical value.
- The readout is endothelial-specific. A peptide that acts on pericyte recruitment or immune signaling will produce nothing here, and its absence of effect is not evidence of inactivity.
Why this assay matters for peptide work
Several of the most studied research peptides carry angiogenesis-related mechanistic claims, which makes tube formation one of the more common entry points for evaluating them in vitro. The peptide fibroblast proliferation assay is essential for assessing the efficacy of these peptides in stimulating cellular activity. Accurate results from such assays can help identify potential therapeutic applications in wound healing and tissue regeneration.
TB-500 is a fragment of thymosin β4, and endothelial migration and network formation are among the better-documented aspects of that protein’s reported activity. Tube formation is the assay where that claim gets tested directly rather than inferred.
BPC-157 has a proposed mechanism running through VEGFR2 signaling and downstream eNOS activity. If that mechanism operates, endothelial network assembly is where it should be visible.
GHK-Cu appears in angiogenesis literature alongside its more commonly cited matrix effects, and endothelial readouts sit adjacent to the collagen endpoints usually measured for it. The GHK-Cu collagen synthesis assay provides a quantitative measure of the peptide’s ability to stimulate collagen production.
The point is not that the assay confirms these claims. It is that tube formation is where such claims become testable at all, and a proangiogenic result in HUVECs is the first piece of evidence rather than the conclusion. Pathway attribution requires orthogonal work, which the following sections return to.
How does the tube formation assay work
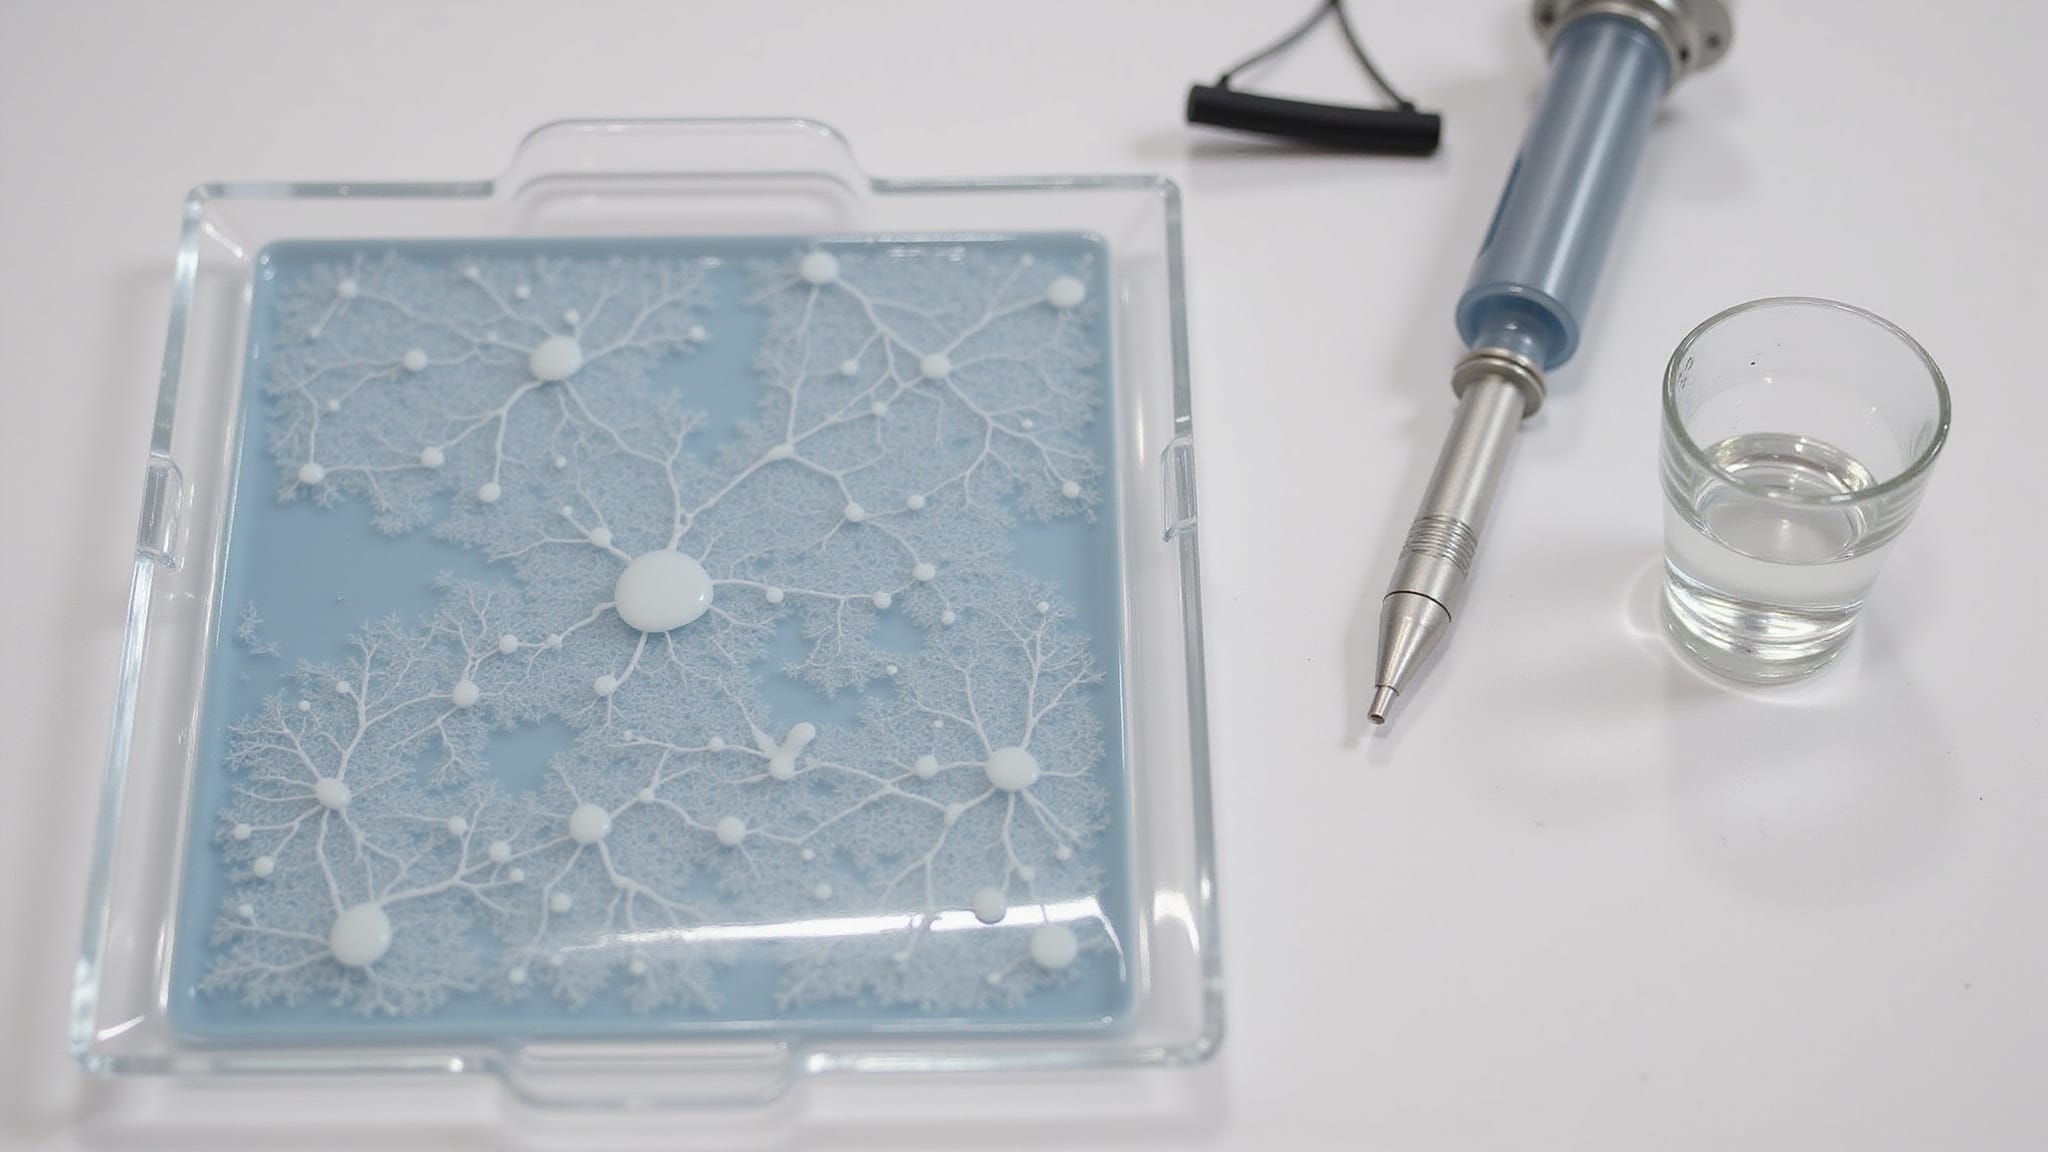
HUVECs are seeded onto a polymerized basement membrane matrix and allowed to align, migrate, and organize into capillary-like networks. The matrix supplies the cues; the peptide condition modifies how the cells respond to them.
Matrix preparation. Keep reduced-growth-factor BME, pipette tips, and plates on ice throughout. BME gels on contact with warmth, and premature gelation in the tip is the most common way to ruin a plate before it starts. Dispense 50 to 80 μL per 96-well, then incubate at 37°C, 5% CO₂ for 30 to 60 minutes until polymerized.
Cell preparation. Detach low-passage HUVECs at 70 to 90 percent confluence and prepare a suspension at 1 to 2 × 10⁵ cells/mL in medium with defined serum. Confluence at harvest matters: over-confluent cells have already begun contact inhibition and form poorer networks regardless of treatment.
Treatment and seeding. Mix peptide test media, including serial dilutions for dose response, with the cell suspension. Seed 100 μL per well to deliver 10,000 to 15,000 cells onto the gel. Serum level, cell density, and BME lot all shift baseline network formation, so every one of them is matched across conditions. The mtt assay for peptide screening allows for efficient evaluation of peptide efficacy in various conditions. By using this assay, researchers can identify optimal peptide concentrations that promote cell viability.
Incubation and imaging. Incubate at 37°C, 5% CO₂. Structures begin appearing within 2 to 4 hours and networks mature by roughly 4 to 6 hours. Regression follows as the cells begin to detach and apoptose, typically after 18 to 24 hours. Choose one timepoint inside the stable window, fix it, and use it for every plate in the study.
Why the imaging timepoint determines the result
This is where the assay most often produces a confident wrong answer, and it deserves separating from the protocol steps.
Tube formation is transient. Networks assemble, hold, and then break down. Late imaging captures regression, and regression looks identical to inhibition: shortened tubes, collapsed branch points, sparse connectivity. A vehicle control imaged at 22 hours and a treated well imaged at 22 hours will both look poor, but a treated well imaged late against a control imaged on time reads as a clean antiangiogenic hit.
The failure has a specific signature worth recognizing. Apparent inhibition that does not scale cleanly with dose, or that appears only in later-processed plates, is usually timing rather than biology. Three controls address it:
- Fix the timepoint before the experiment, not after looking at the plate. Choosing when to image based on which timepoint gives a cleaner result is how a timing artifact becomes a finding.
- Image every well in a study at the same elapsed time from seeding, not the same clock time. Staggered seeding requires staggered imaging.
- Run a parallel viability check. A peptide that kills HUVECs produces network collapse that is indistinguishable from specific antiangiogenic activity by image analysis alone. Cytotoxicity has to be excluded before inhibition can be claimed.
How do you quantify tube formation metrics
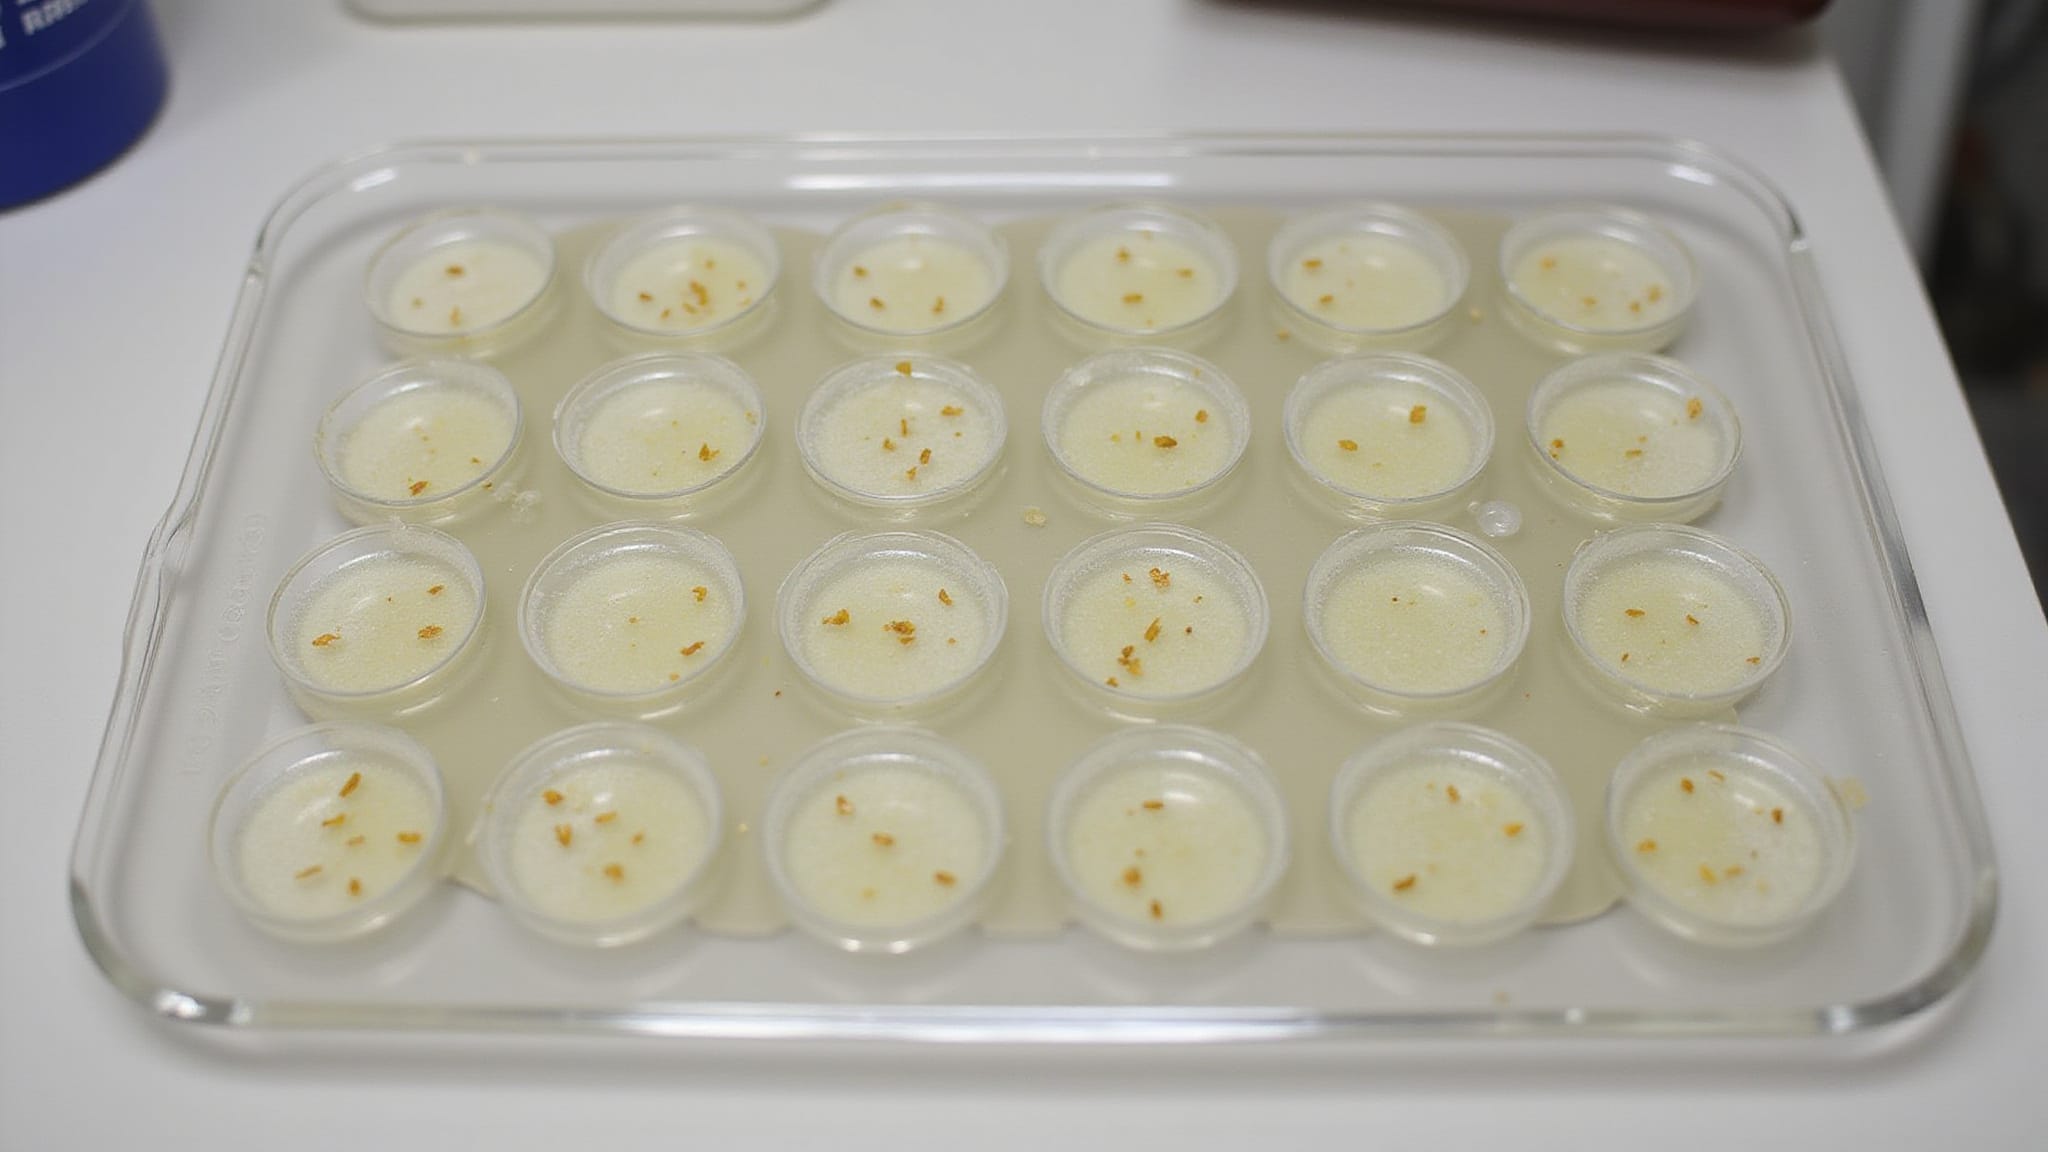
Quantification converts images into predefined network measures. Acquire identical fields per well at fixed magnification and exposure, then threshold phase-contrast or Calcein AM fluorescence images and analyze with ImageJ angiogenesis plugins or equivalent.
| Metric | Measurement focus |
|---|---|
| Total tube length | Summed segment distance |
| Branch points | Junction frequency |
| Nodes | Connected cell clusters |
| Meshes | Closed polygon networks |
| Covered area | Fraction of field occupied by structures |
The metrics are not interchangeable. Total tube length can rise while mesh count falls, which describes a network that is longer but less connected. Reporting one metric alone allows a selective reading, so the convention is to report several and let a disagreement between them be visible rather than hidden.
Batch-process with identical settings, exclude edge artifacts, average replicate wells, and normalize treated wells to vehicle controls. Report mean with SD or SEM, export per-field values before statistical testing, and retain raw images. Thresholding is the step where analyst choice enters the data, which is the argument for processing every plate through one saved configuration rather than tuning per image.
What do tube formation results establish
A tube formation result establishes whether a peptide changes endothelial network architecture under defined conditions. That is a narrower claim than it usually gets read as.
What a positive result supports: total tube length, nodes, loops, and meshes rising with dose, replicate wells holding low variance, and controls forming stable networks together indicate that HUVECs respond to the compound. That is endothelial responsiveness, measured.
What it does not support: the pathway. Network changes are the integrated output of migration, adhesion, survival, and matrix interaction. A peptide could increase tube length by promoting migration, by improving survival, or by altering how cells engage the gel, and image metrics cannot distinguish among them. Attribution requires orthogonal evidence: receptor blockade, knockdown, phosphorylation readouts, or migration assays run separately.
The same limit applies to negative results. No effect in HUVECs means no effect on this cell type, in this matrix, at these concentrations, in this window. It is not evidence of inactivity in a system containing the cell types this model omits.
Conclusion
Tube formation is one of the fastest functional readouts available for endothelial work, and its speed is also its main hazard. Networks assemble within hours and disassemble within a day, which means the difference between a result and an artifact often comes down to when the plate was imaged rather than what was in the well.
Two habits carry most of the reliability. Fix the imaging timepoint before running the experiment and hold it for every plate, because a window chosen after seeing the data is not a window, it is a selection. And pair any apparent inhibition with a viability check, since a compound that kills endothelial cells produces image metrics indistinguishable from one that specifically disrupts network assembly.
Beyond that, hold the claim to what the assay measures. HUVECs in a gel are a single cell type without pericytes, smooth muscle, or perfusion, and the structures they form are capillary-like rather than capillaries. A dose-dependent increase in tube length is a reason to run the next experiment. It is not the finding itself.
Get Batch-Tested Peptides for Every Study
From scratch assays to HUVEC tube formation, your research deserves peptides that meet the highest quality standards. Holas supplies laboratory-grade peptides produced under strict internal quality controls, with third-party testing for purity, identity, and consistency. Explore our research bundles, browse the shop, or contact us to build your research toolkit.
Frequently Asked Questions
How many HUVECs should be seeded per well?
10,000 to 15,000 cells in 100 μL medium per 96-well, prepared from a suspension at 1 to 2 × 10⁵ cells/mL and seeded onto polymerized matrix. Cell density shifts baseline network formation, so it is matched across every condition in a study rather than adjusted per plate.
When should tube formation be imaged?
Structures begin forming within 2 to 4 hours and networks mature by roughly 4 to 6 hours, with regression typically following after 18 to 24 hours. Choose one timepoint inside the stable window before the experiment starts and use it for every plate, measured as elapsed time from seeding rather than clock time.
Why does the imaging timepoint matter so much?
Tube formation is transient, and regression produces shortened tubes and collapsed branch points that look identical to inhibition. A treated well imaged late against a control imaged on time reads as a clean antiangiogenic result when nothing of the kind occurred.
Can tube formation distinguish inhibition from cytotoxicity?
Not on its own. A peptide that kills HUVECs produces network collapse indistinguishable from specific antiangiogenic activity by image analysis. A parallel viability check is what separates the two, and inhibition should not be claimed without one.
Which metrics should be reported?
Total tube length, branch points, nodes, loops, meshes, and covered area, reported together rather than singly. The metrics can disagree, since total tube length can rise while mesh count falls, describing a longer but less connected network. Reporting several makes that disagreement visible.
Does a positive result identify the mechanism?
No. Network changes are the integrated output of migration, adhesion, survival, and matrix interaction, and image metrics cannot distinguish among them. Pathway attribution requires orthogonal evidence such as receptor blockade, knockdown, phosphorylation readouts, or separate migration assays.
What does the HUVEC model leave out?
Pericytes, smooth muscle, immune cells, and perfusion. HUVECs are one cell type in isolation, and the structures they form on basement membrane gel are capillary-like rather than vessels. A compound acting on the cell types this model omits will produce no signal here, and that absence is not evidence of inactivity.