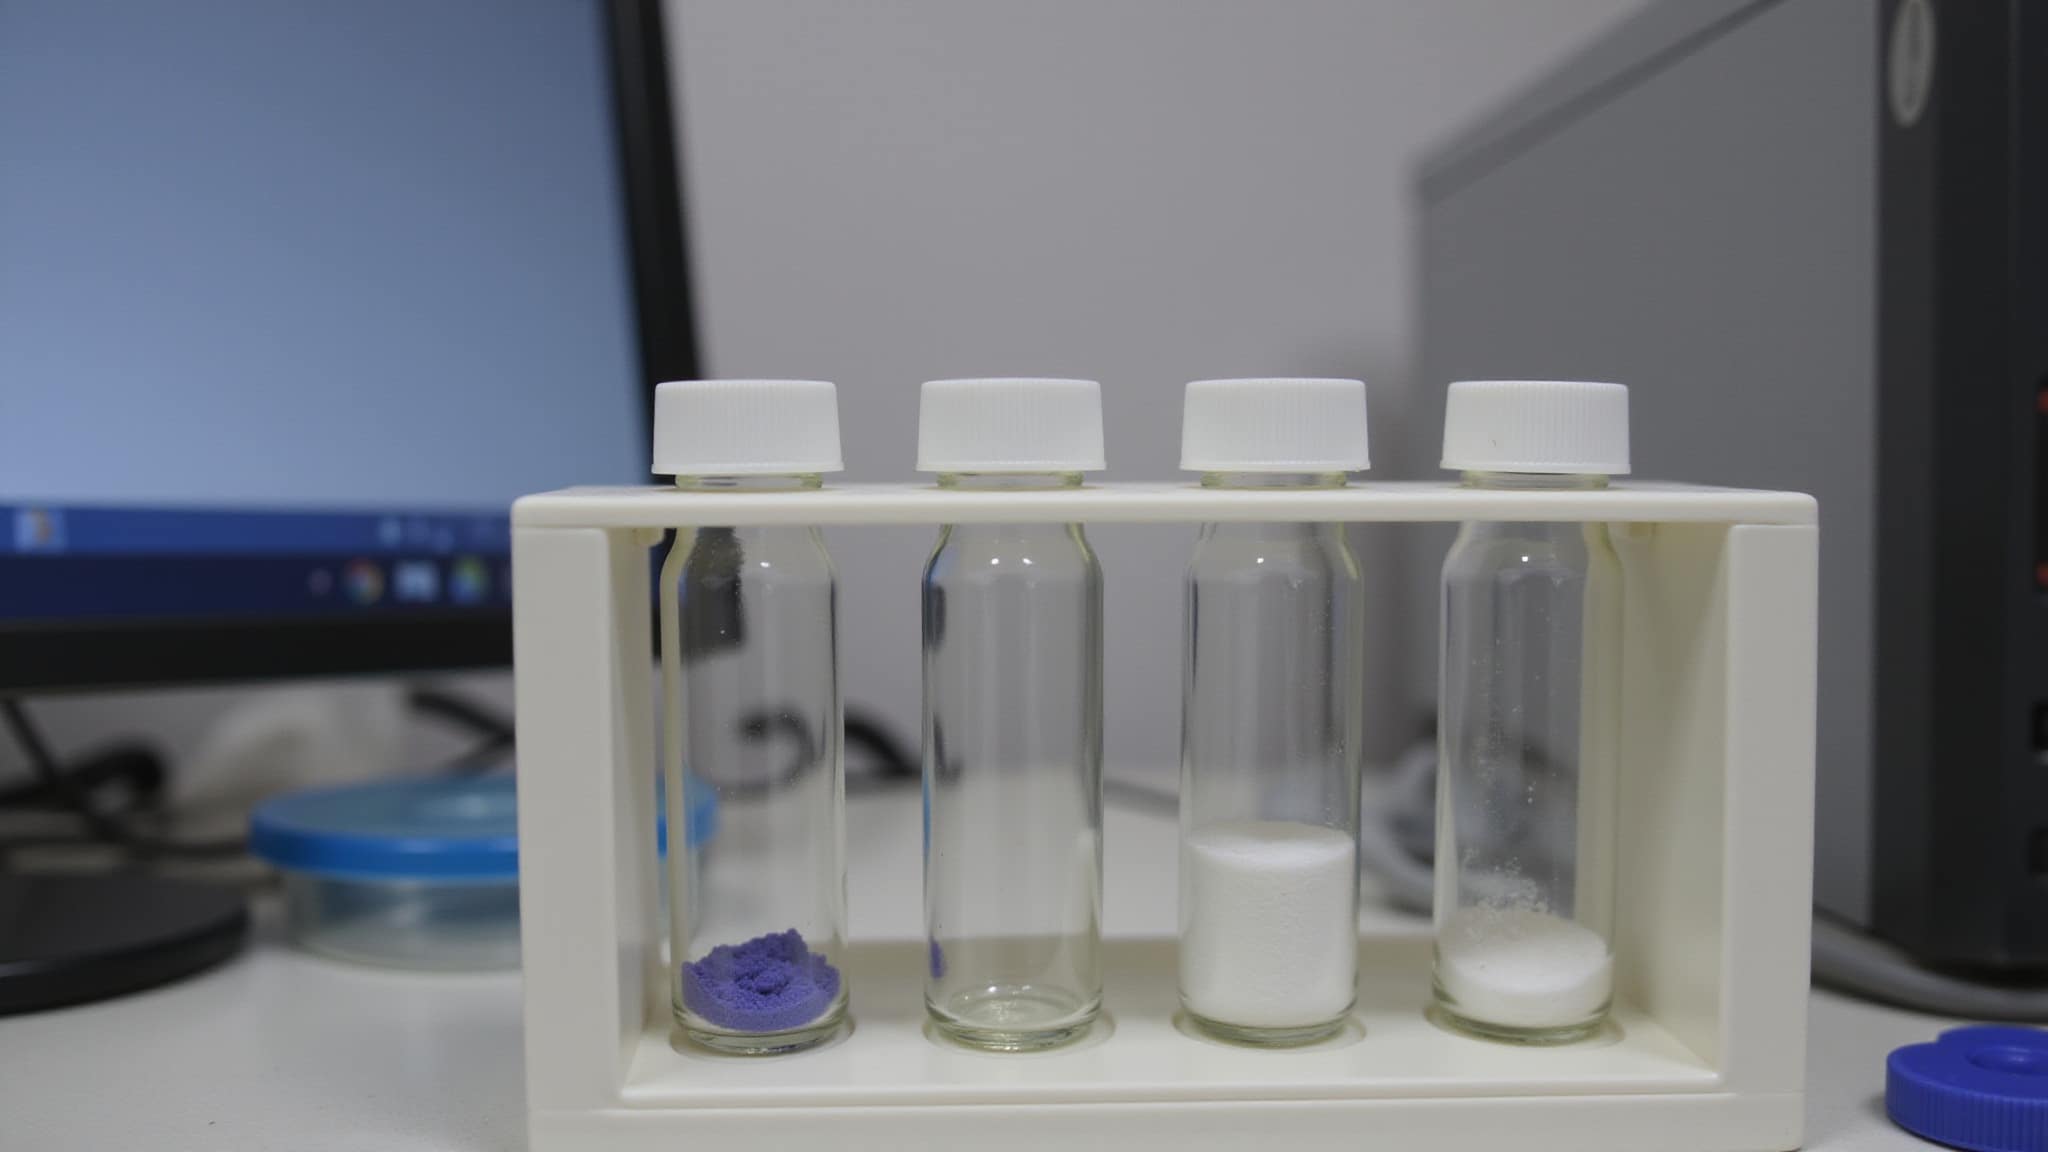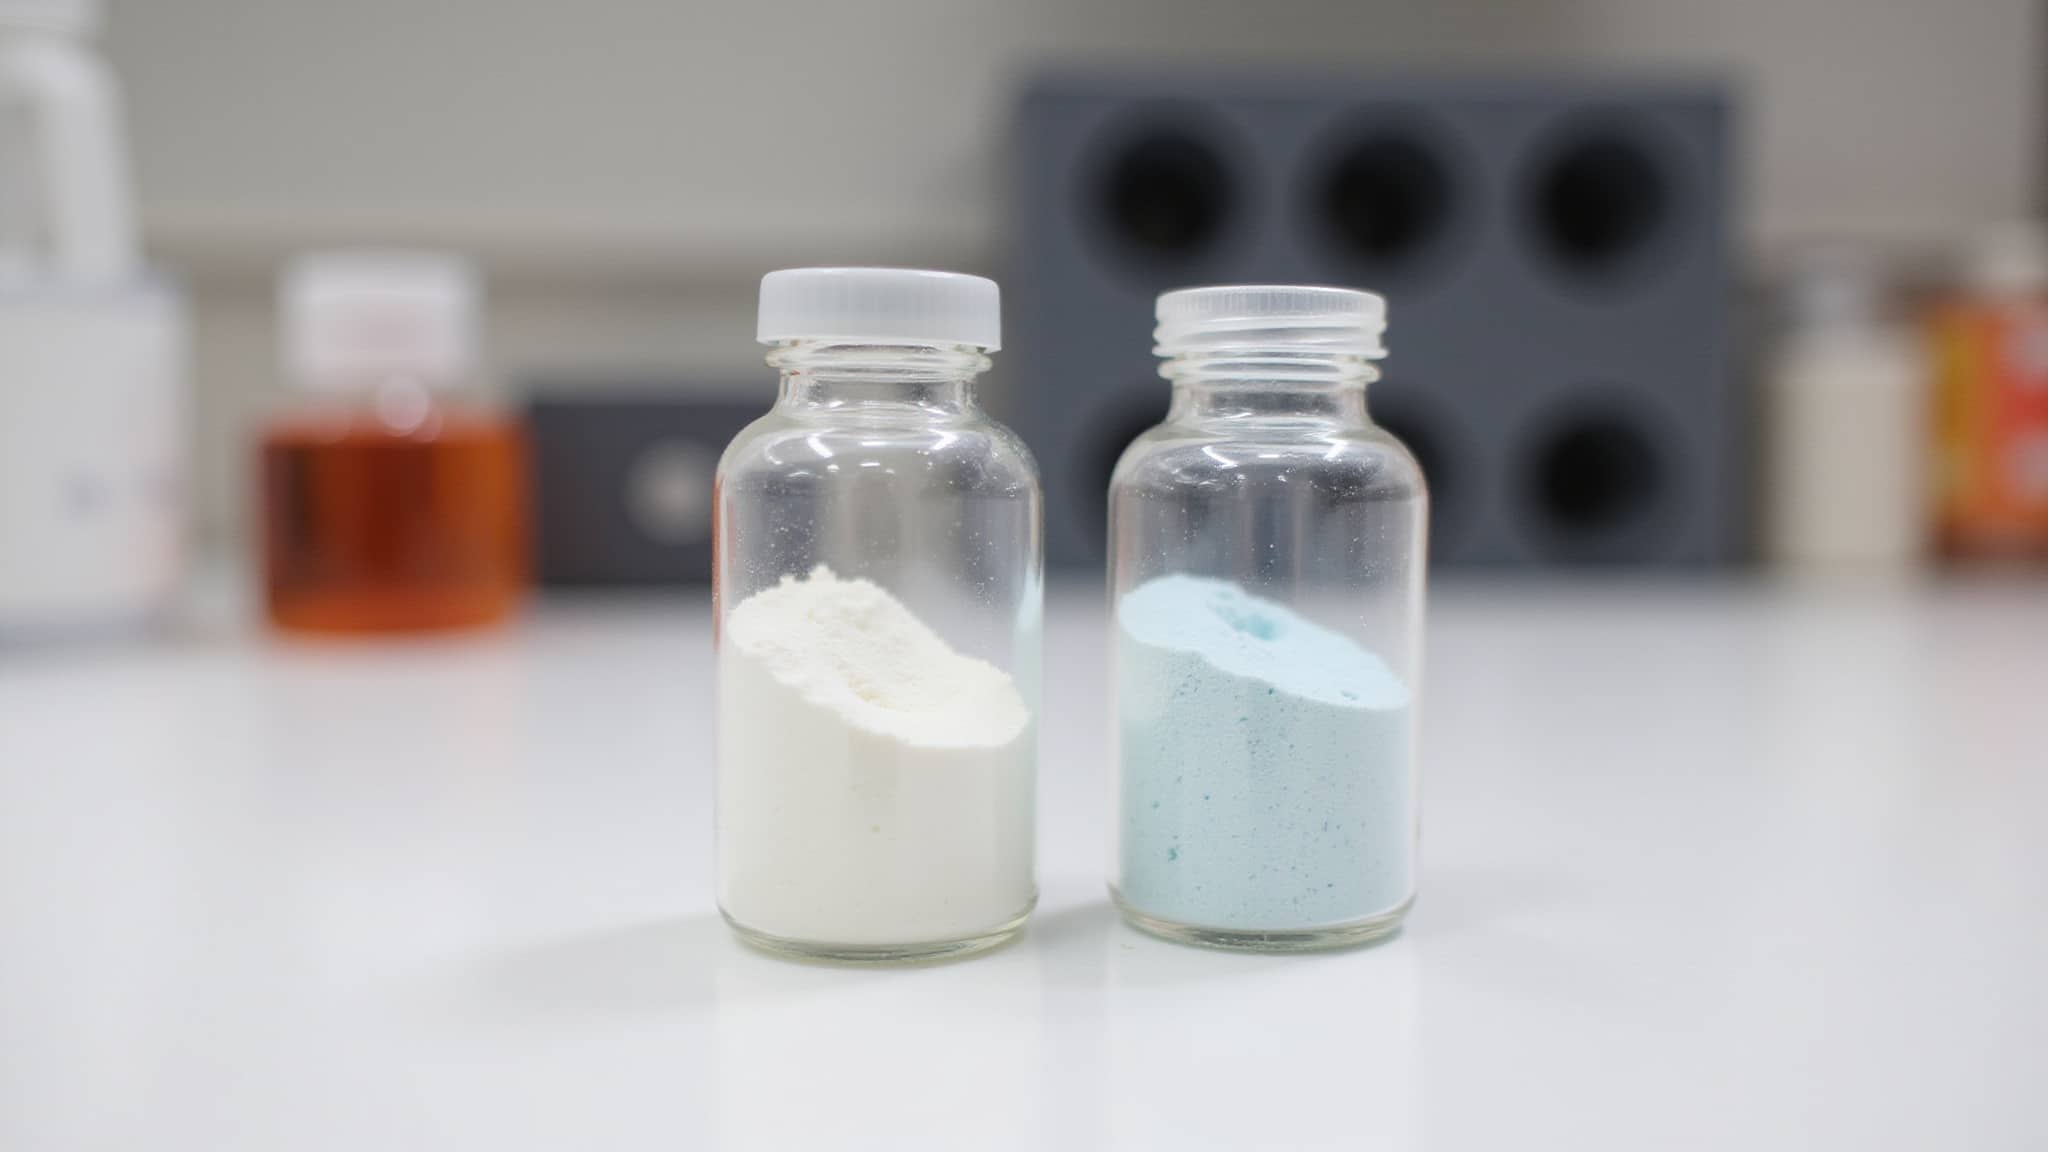
The MTT assay measures how peptide exposure changes viable-cell metabolism. NAD(P)H-dependent oxidoreductases reduce yellow MTT to purple formazan, which is solubilized and measured at 570 nm, often minus a 630 nm background. Cells are seeded in 96-well plates, treated with peptide dilutions alongside controls and blanks, and viability is calculated as treated over control absorbance times 100. Dose-response curves estimate IC50, while interference checks catch peptide color, precipitation, or redox artifacts before results are trusted.
Key Takeaways
- MTT measures viable-cell metabolic reduction of yellow tetrazolium to purple formazan, typically read at 570 nm with 630 nm background correction.
- Peptide screening uses concentration gradients, technical replicates, untreated controls, vehicle controls, blanks, and a positive cytotoxicity control.
- Cells are seeded in 96-well plates within the assay’s linear range, allowed 12 to 24 hours to attach, then exposed to peptide dilutions.
- After exposure, MTT is added, incubated 2 to 4 hours at 37°C, formazan is solubilized with DMSO, and absorbance is read consistently.
- Viability is calculated as treated over control absorbance times 100, dose-response curves are fitted, and peptide color, precipitation, or redox interference is checked.
MTT Cell Viability Assay for Peptide Screening

The MTT cell viability assay screens peptides for cytotoxicity or growth inhibition by linking viable-cell metabolism to a measurable color change: living cells reduce yellow MTT into insoluble purple formazan through NAD(P)H-dependent oxidoreductase activity. This signal supports cell viability screening by comparing treated wells with untreated controls after peptide exposure. Higher absorbance indicates more metabolically active cells; lower absorbance indicates reduced viability, impaired proliferation, or peptide-driven toxicity. Viability testing of peptides typically runs concentration gradients, replicate wells, vehicle controls, and blank corrections to separate true biological effects from background. Absorbance is then converted to percent viability using treated over control ratios, and dose-response behavior is modeled. This format gives quantitative, plate-based readouts suitable for ranking peptide potency, selectivity, and cytotoxic risk.
What the MTT assay is and how it works
The MTT assay is a colorimetric test that measures cellular metabolic reducing activity. Yellow MTT, a tetrazolium salt, is added to cells, where NAD(P)H-dependent oxidoreductase enzymes reduce it to insoluble purple formazan crystals. Viable, metabolically active cells generate more formazan; damaged or inactive cells generate less.
In a standard MTT protocol, the crystals are dissolved with DMSO or SDS-HCl, then absorbance is read at 570 nm, often with a 630 nm reference to subtract background. Within the assay’s linear range, absorbance scales with viable cell number and mitochondrial function. That is why this assay gives a quantitative signal rather than a direct cell count. Higher optical density is interpreted as higher metabolic activity, assuming no chemical interference alters MTT reduction.
How to screen peptides using MTT assays
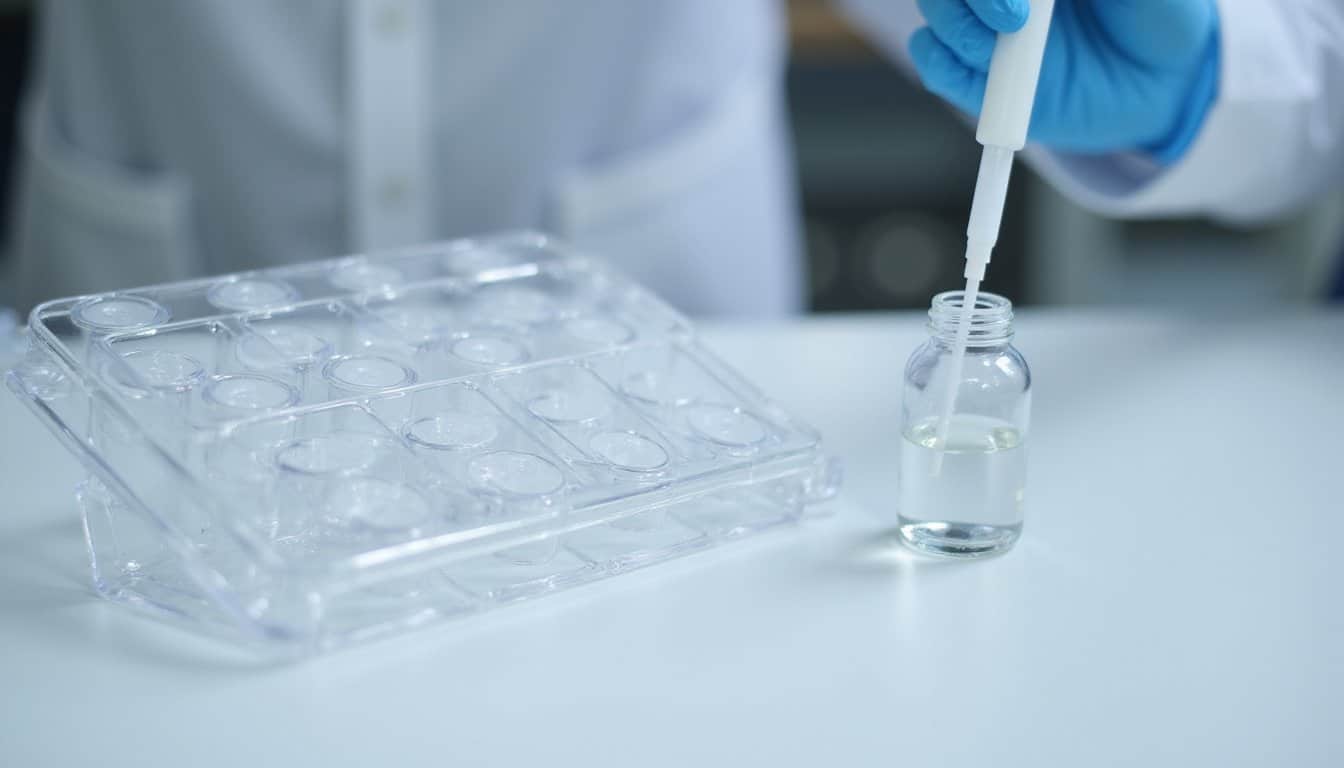
Peptide screening by MTT treats cells with serial peptide dilutions and measures metabolic activity relative to untreated control wells. Cells are seeded in 96-well plates at a density that stays linear during the assay, then incubated 12 to 24 hours for attachment. Serial peptide dilutions are added alongside vehicle, untreated, blank, and positive-control wells, with technical replicates throughout. After exposure, medium is gently removed, 50 µL serum-free medium is added, followed by 50 µL MTT at 5 mg/mL in PBS. The plate is incubated 2 to 4 hours at 37°C and 5% CO₂, letting viable cells generate formazan. Crystals are solubilized with DMSO for 10 minutes, shaken at 100 to 150 rpm, and read at 570 nm with a 630 nm reference. Viability is calculated as treated over control times 100, and dose-response curves are fitted for IC50 estimates.
What cell viability measures in peptide screening
Cell viability in peptide screening measures the percentage of living, metabolically active cells remaining after peptide treatment relative to untreated controls. In an MTT assay, viable cells are quantified through NAD(P)H-dependent oxidoreductase activity, which reduces yellow MTT into insoluble purple formazan. More metabolically active cells generate more formazan, so higher absorbance at 570 nm, often corrected at 630 nm, indicates greater viability. Fibroblast proliferation assay for peptides can provide valuable insights into the effects of specific peptides on cell growth.
The result is expressed as percent viability: mean absorbance from peptide-treated wells divided by mean absorbance from control wells, multiplied by 100. A peptide that damages membranes, inhibits mitochondrial function, or triggers cytotoxic stress produces reduced MTT conversion and lower absorbance. Across a concentration series, viability is plotted against peptide dose to define potency metrics such as IC50, the concentration that reduces viability by 50%.
Advantages and limitations of MTT

MTT is low-cost, plate-reader-friendly, and links viable-cell redox metabolism to a measurable 570 nm formazan signal. Its limitations include interference from redox-active peptides, lower sensitivity than ATP assays, and dependence on complete crystal solubilization. The endpoint visualizes yellow MTT becoming purple crystals through NAD(P)H-dependent oxidoreductases.
| Advantage | Limitation |
|---|---|
| Purple wells show active metabolism. | Redox peptides can reduce MTT directly. |
| 570/630 nm reading improves precision. | Sensitivity trails ATP assays by about 100-fold. |
| 96-well format supports peptide titrations. | Insoluble crystals demand complete solubilization. |
| Signal often scales with viable-cell number. | Mitochondrial shifts can skew output. |
There is also a speed-for-simplicity trade: DMSO dissolves formazan in about 10 minutes, while SDS-HCl may need 4 to 18 hours. Timing, light exposure, and mixing should stay consistent across wells.
How to interpret MTT assay results
MTT results are interpreted by using absorbance at 570 nm, corrected with a 630 nm reference, as a proxy for viable-cell metabolic reduction of MTT to formazan. First, blanks containing medium, reagent, and solvent but no cells are subtracted. Technical replicates are then averaged and their coefficients of variation inspected; high scatter usually signals uneven seeding, incomplete crystal dissolution, evaporation, or pipetting error. Each treated mean is normalized to the untreated or vehicle control: viability (%) = treated absorbance/control absorbance × 100. Viability is plotted against peptide concentration on a log scale, and a sigmoidal curve is fitted to estimate IC50 when the response spans 50%. Linearity between cell number and absorbance should be confirmed for the density range in use. Peptide color, precipitation, or redox activity should be flagged, since these can shift absorbance independently of metabolism.
What viability findings reveal about peptide cytotoxicity
Viability findings indicate whether a peptide shows low acute cytotoxicity across the tested concentration ranges in culture. Treated-well absorbance at 570 nm, corrected at 630 nm, is compared with vehicle controls to quantify metabolic retention: viability = mean treated/mean control × 100. A peptide that preserves 80 to 90% viability or more across the tested ranges provides preliminary evidence of low acute cytotoxicity in that cell model. A steep decline, low IC50, or concentration-dependent loss of mitochondrial signal flags membrane disruption, redox stress, or metabolic inhibition.
It is also important to confirm that the peptide itself does not reduce MTT or alter formazan solubilization, since assay interference can mimic toxicity. Replicate consistency, narrow confidence intervals, and parallel morphology checks strengthen interpretation. A usable selectivity window appears when a peptide’s active concentration sits below its cytotoxic concentration in the model system.
Conclusion
The MTT assay remains a practical first-line method for ranking peptide cytotoxicity and potency, converting viable-cell redox metabolism into a quantitative 570 nm signal that supports dose-response fitting and IC50 estimation. Its value lies in low cost and plate-based throughput; its main constraints are redox interference from the peptide itself and a resolution ceiling that calls for orthogonal confirmation. Read with proper controls and interference checks, it reliably flags which peptides warrant deeper study and which raise cytotoxicity concerns in a given cell model.
Every one of those readouts depends on the material in the well. Redox-active impurities, inconsistent content, and batch-to-batch variability can shift MTT signal independently of true cell metabolism, blurring the line between genuine toxicity and assay artifact. Starting with research peptides of verified purity and consistent batch quality removes a major source of that ambiguity and keeps viability data comparable across experiments.
Order Peptides Verified for Your Assays
Your assay results are only as strong as the peptides you start with, and Holas delivers verified research-grade material for consistent, reliable outcomes. Every batch is backed by independent lab results, with proper endotoxin testing and purity verification for cell-based assay work. Browse our shop or reach out to source the right materials for your protocols.
Frequently Asked Questions
How can redox-active peptides be distinguished from genuine cytotoxicity in an MTT assay?
A cell-free control containing the peptide, MTT, and medium but no cells reveals whether the peptide reduces MTT on its own. Signal in that well points to direct chemical interference rather than a metabolic effect. Pairing MTT with an orthogonal endpoint, such as an ATP or LDH assay, confirms whether a viability drop reflects real toxicity or an artifact of the peptide’s redox chemistry.
What seeding density gives reliable MTT results for peptide screening?
The density should keep cells within the assay’s linear range at the endpoint, so absorbance still scales with viable cell number rather than plateauing from overconfluence. The workable number depends on the cell line’s size and doubling time, and is confirmed by running a cell-number versus absorbance standard curve. Densities that reach confluence before the reading is taken compress the dynamic range and mask peptide effects.
Why is a 630 nm reference reading subtracted from the 570 nm signal?
Formazan absorbs strongly near 570 nm, while 630 nm falls outside its main absorbance and captures non-specific background from the plate, debris, or turbidity. Subtracting the 630 nm value from the 570 nm value isolates the formazan-specific signal and improves precision. This correction matters most when wells carry particulates or slight optical inconsistencies.
When is DMSO preferred over SDS-HCl for solubilizing formazan?
DMSO dissolves formazan crystals in roughly 10 minutes and suits fast, same-day readouts, though it requires prompt, even reading before evaporation shifts absorbance. SDS-HCl works more slowly, over about 4 to 18 hours, but tolerates longer holds and can handle serum-containing conditions. The choice depends on throughput needs and how the plate is handled after solubilization.
Can the MTT assay measure peptide-driven proliferation as well as toxicity?
Absorbance above the untreated control across a concentration series can indicate increased metabolic activity or cell number, which may reflect a proliferative response. Because MTT reports metabolic reduction rather than counting cells directly, an apparent increase is confirmed with a direct proliferation readout such as a cell-count or DNA-content assay. This separates a true rise in cell number from a metabolic shift in a fixed population.